

Solarshare needed a connected sales and engineering tool that could turn a proposed rooftop solar installation into a useful conversation about electricity generation, household consumption, costs and carbon emissions. Impact developed the calculation API, a Google Maps-based panel-layout interface and a customer portal for working with Building Energy Rating (BER) information.
Design a solar installation on the customer's roof
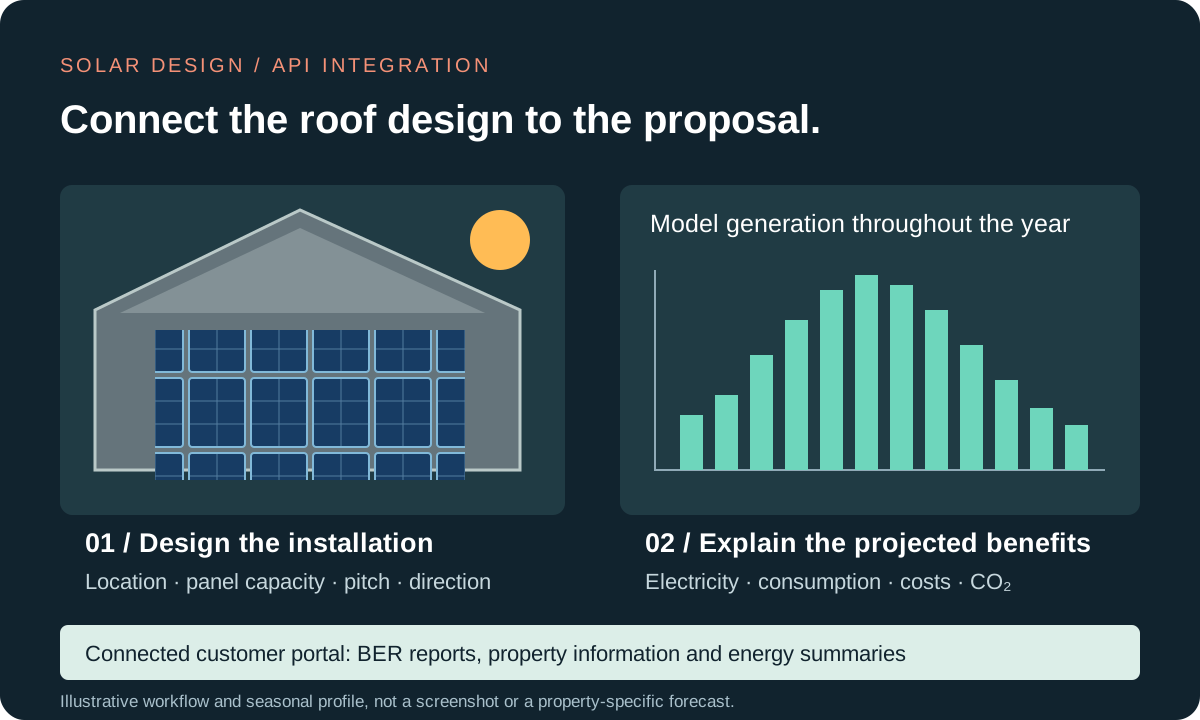
The front end lets an engineer position an array of solar panels over a roof using Google Maps. Panel rows, columns, dimensions and portrait or landscape orientation define the proposed layout. Roof pitch and compass direction connect that visual design to the energy calculation, while the panel rating determines the proposed system's peak power.
The interface projects the panel layout onto the map using geographic geometry, accounting for pitch when displaying its footprint. This brings the proposed installation and its calculation inputs into the same workflow, helping the sales and engineering teams explore alternatives with a customer.
A solar generation API built around location, pitch and direction
The PHP calculation service integrates with PVGIS to request monthly photovoltaic generation estimates. The request includes the property's latitude and longitude, installed peak power, panel angle and aspect, together with the configured system assumptions.
The application uses monthly generation data with stored hourly profiles to build a more detailed energy model. This supports comparisons between electricity produced and electricity consumed throughout the year, rather than relying on an annual generation total alone.
Separating the calculation into an API gives the design interface, reports and other application components a shared calculation service. Engineers can change the proposed layout and input assumptions, then use the resulting estimates to compare options.
Connect generation to consumption, batteries and savings
A useful solar proposal needs to explain what happens to the electricity after it is generated. The model brings together generation, estimated consumption, grid electricity and battery scenarios to calculate monthly summaries and annual totals. It includes self-sufficiency and use of generated electricity, alongside financial and carbon calculations.
The reporting workflow turns those calculations into an explanation a customer can use: the proposed installation, estimated electricity production, changes in grid use and projected cost and CO₂ savings. Survey comparison reports also bring multiple proposed configurations together, helping the team discuss trade-offs between panel capacity, battery size and expected use.
These figures are modelled estimates based on the selected system, consumption and financial assumptions. The software supports comparison and proposal preparation; this case study does not present a particular household's projected saving as a measured project result.
A customer portal for BER reports and property information
The project extends beyond solar-panel design into a portal for property energy information. Users can bring in BER reports and review information about their property's energy performance and carbon footprint, providing a starting point for understanding potential improvements and savings.
The implementation includes document-upload and OCR processing workflows, BER reference-data imports and matching of extracted report information to stored BER records. Portal reporting makes the resulting information available alongside property and survey records, connecting source documents with a more usable account of the building's performance.
This connects the customer-facing experience with the data-processing work behind it: importing documents, identifying the relevant fields, linking records and presenting useful summaries.
Business software joining mapping, engineering and customer advice
- More useful sales conversations: connect a visible roof layout to the inputs and estimates behind the proposal.
- Consistent calculations: use an API across the design and reporting workflow.
- Clearer option comparisons: review the effects of different panel layouts, capacities and battery scenarios.
- Accessible energy information: bring BER documents and property records into a customer portal.
- Joined-up reporting: present generation, consumption, financial and carbon estimates together.
Bespoke solar software and API integration
Solarshare combines PHP API development, Laravel web applications, JavaScript mapping, database-backed modelling, external generation data and document processing. It demonstrates Impact's ability to connect specialist calculations with the operational tools and customer interfaces around them.
Explore our API development and integration services, Blutex document-processing software and Bisedge operational reporting platform, or browse more API projects.
Talk to Impact about solar design software, engineering calculations or a connected customer portal.